LOS ANGELES – The Directors Guild of America today released a report analyzing the ethnicity and gender of directors hired to direct primetime episodic television across broadcast, basic cable, premium cable, and high budget original content series made for the Internet.
The DGA analyzed more than 3,500 episodes produced in the 2013-2014 network television season and the 2013 cable television season from more than 220 scripted series. The report showed that:
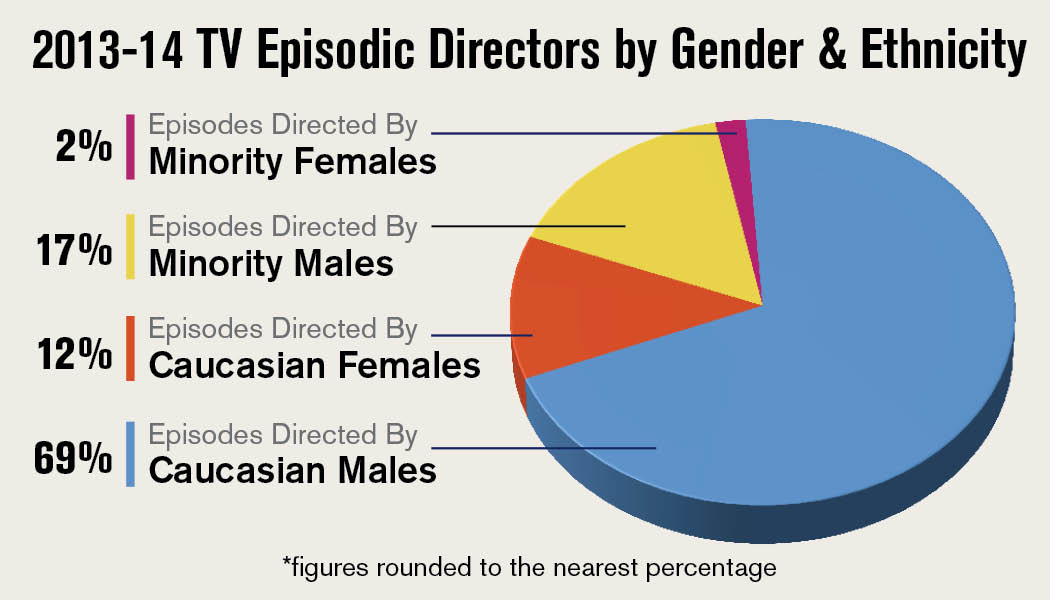
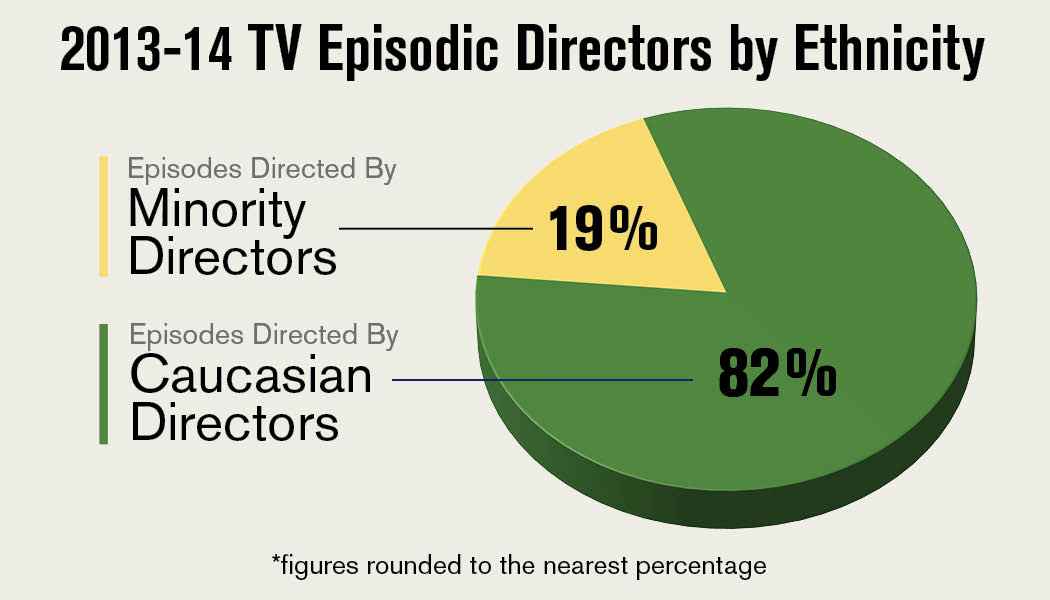
- Caucasian males directed 69% of all episodes;
- Minority males directed 17% of all episodes;
- Caucasian females directed 12% of all episodes; and
- Minority females directed 2% of all episodes.
2013-2014 In Comparison With Previous Years
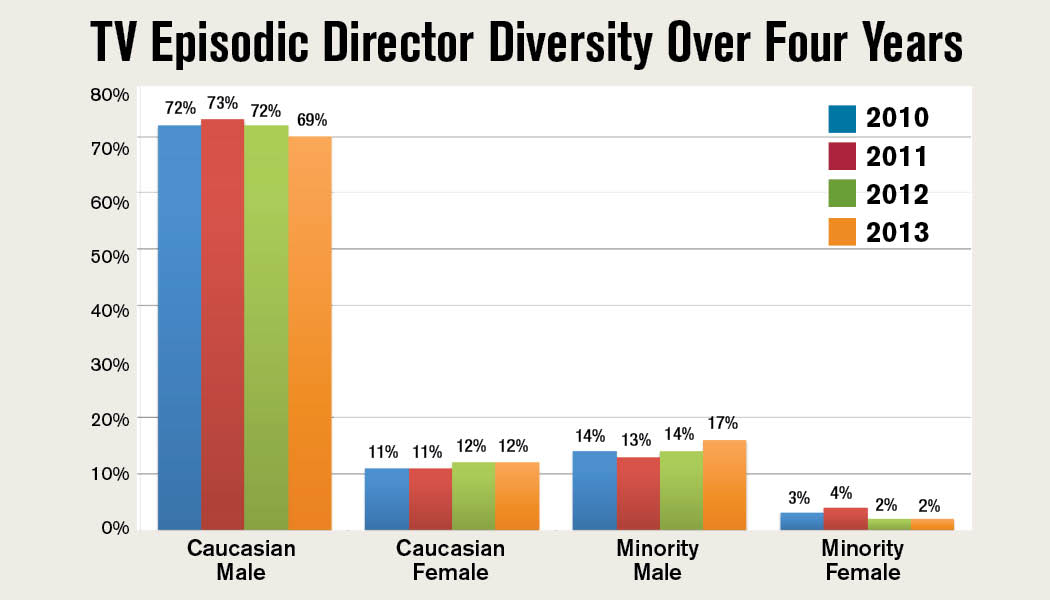
Comparing figures for 2013-2014 with figures from 2012-2013, this year’s report shows that:
- The percentage of episodes directed by Caucasian males decreased from 72% to 69%;
- The percentage of episodes directed by minority males increased from 14% to 17%;
- The percentage of episodes directed by Caucasian females remained static at 12%; and
- The percentage of episodes directed by minority females remained static at 2%.
While the statistics show no improvement in the percentage of episodes being directed by women, minority males directed 3% more episodes this year than in the previous year. However, closer analysis reveals that this increase can be entirely attributed to the high number of episodes directed by a single director, Tyler Perry, who directed all episodes of three television series that he also produced, accounting for the entire 3% gain.
The bar graph below shows that there has been no significant improvement in diversity hiring practices in episodic television during the past four years.
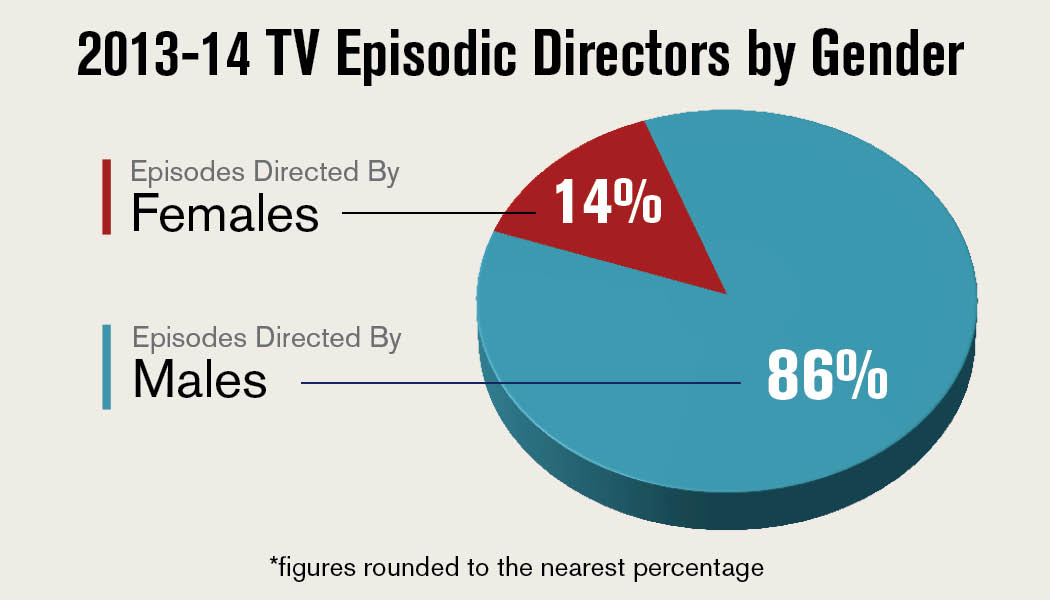
Male directors still directed 86% of all episodes, and Caucasian males still directed seven out of every 10 episodes. Women and minority males combined still directed just 3 out of every 10 episodes.
“Unfortunately, it can be shockingly difficult to convince the people who control hiring to make even small improvements to their hiring practices,” said DGA President Paris Barclay. “But the end result is something worth fighting for. This should matter to all of us, as a culture, as an industry, and as directors. People often say, ‘everybody is responsible for diversity,’ but in the end, that often means that nobody takes responsibility. It’s time for the people who make the hiring decisions – be they studios, networks, production companies, or individual producers – to stop making excuses, stop passing the buck, and start living up to the country’s promise and possibility by providing true equal opportunity.”
Breakdown by Series
Out of 225 series examined, 23 (10%) hired no women or minority directors at all, and 39 more series (17%) hired women or minorities to direct fewer than 15% of episodes. This means that more than a quarter of all episodic television series made under a DGA contract had hiring statistics poor enough to land a spot on the DGA’s “Worst Of” list (which can be found at the bottom of the report). Several of those series made repeat appearances, having also placed on the DGA’s “Worst Of” lists last year, including: Bates Motel; Boardwalk Empire; Californication; Castle; CSI: Crime Scene Investigation; Dog with a Blog; The Exes; Hot In Cleveland; It’s Always Sunny in Philadelphia; Maron; The Mindy Project; NCIS; The Neighbors; Nikita; Once Upon A Time; Sullivan & Son; Supernatural; and Workaholics.
 Taking a look at just three examples, we can see that in four seasons, Boardwalk Empire hired women to direct just two episodes (4%) and not a single minority to direct any episodes out of 48 total episodes. In the past three seasons, NCIS hired women to direct seven episodes (10%) and a minority to direct just one episode (1%) out of a total of 72 episodes, and during the same time period, CSI: Crime Scene Investigation hired one minority woman to direct 3 episodes (5%) and one Caucasian woman to direct one episode (2%) out of 66 total episodes.
Looking at the opposite side of the equation, 49 series, or 22% of all series examined, demonstrated a commitment to diverse hiring practices, hiring women or minorities to direct at least 40% of episodes. These shows are highlighted on the DGA’s “Best Of” list at the bottom of the report. Of note, the DGA changed the criteria for its “Best Of” list in this year’s report. Instead of setting the threshold for inclusion on the “Best Of” list to include any show that hired above the industry’s average of hiring women or minorities to direct 30% of episodes, the DGA decided to set the bar higher, at 40%, in hopes of inspiring more shows to engage in more diverse hiring practices.
 Even with the higher threshold, a remarkable 24 series out of the 49 highlighted also appeared on last year’s “Best Of” list, indicating that shows with a demonstrable commitment to hiring diversity tend to engage in those diverse hiring practices season after season.
“I’m thrilled to see all the series that have demonstrated a serious commitment to diverse hiring, including some brand new series that hit diversity home runs right out of the gate in their first seasons,” said Betty Thomas, co-chair of the DGA Diversity Task Force and First Vice President. “These shows are some of the most well-respected, and award-winning, shows on television, and I wouldn’t hesitate to say that the diversity of their directors plays a significant role. I hope the shows that have failed to hire women, or minorities – in the year 2014! – soon understand that their shows can only benefit by broadening the range of creative voices that form their teams.”
776 Total Episodic Directors in 2013-2014
For the first time, this year’s report also analyzed in greater detail the number of male, female, Caucasian, and minority directors who directed this season. The following statistics are helpful in looking at the number of individuals directing in a season and patterns in the number of episodes these individuals directed.
There were a total of 776 directors who directed episodic television made under a DGA agreement this season. Of those 776:
- 647 (83%) were male;
- 129 (17%) were female;
- 681 (88%) were Caucasian;
- 52 (7%) were African American;
- 24 (3%) were Latino; and
- 19 (2%) were Asian American.
The DGA also examined the distribution of episodes within each group. The DGA found that in general, approximately half of all directors in each group directed a total of 1 or 2 episodes throughout the season, about a third of directors in each group directed between 3 and 7 episodes throughout the season and about one-fifth of directors in each group directed 8 episodes or more.
|
|
# of Male Directors |
# of Female Directors |
# of Caucasian Directors |
# of African American Directors |
# of Latino Directors |
# of Asian American Directors |
|
1-2 episodes |
302 (47%) |
64 (50%) |
326 (48%) |
20 (38%) |
10 (42%) |
10 (53%) |
|
3-7 episodes |
233 (36%) |
43 (33%) |
244 (36%) |
18 (35%) |
10 (42%) |
4 (21%) |
|
8 or more episodes |
112 (17%) |
22 (17%) |
111 (16%) |
14 (27%) |
4 (17%) |
5 (26%) |
First-Time Episodic Directors in 2013-2014
Out of 776 directors who directed DGA-covered episodic television in 2013-2014, 108 (14%) of those directors were directing episodic television for the first time.
- 73 (68%) were Caucasian males;
- 13 (12%) were Minority males;
- 19 (18%) were Caucasian females; and
- 3 (3%) were Minority females.
Similar to the overall statistics for 2013-2014, seven out of every 10 first-time episodic directors were Caucasian males – a figure that indicates that even when it comes to hiring new directors, those with responsibility for hiring are repeating old hiring patterns, thereby perpetuating the status quo. With new episodic directors representing a sizeable portion of the year’s episodic directors overall, this could be a significant area of opportunity to broaden the diversity of the hiring pool.
“There’s an ever-growing amount of work in episodic television these days, and new directors are being hired all the time,” said Todd Holland, co-chair of the DGA’s Diversity Task Force and Alternate National Board Member. “That means that there is also growing opportunity, each and every day, for those in charge of hiring to make more inclusive decisions; to improve their hiring practices; to help create an entertainment community that better reflects the richness of the world around us.”
DGA Diversity Efforts
Although the DGA has no authority over hiring, it employs many other initiatives as part of its diversity efforts, including negotiating diversity provisions during the collective bargaining process; meeting directly with studios, production companies, and individual shows; tracking and publicizing employment statistics; appointing prominent members to the National Board’s Diversity Task Force; supporting the Guild’s member diversity committees; supplying those who hire with lists of experienced diverse directors; and calling attention to talented, diverse voices through the DGA Quarterly magazine, the DGA Student Film Awards, and the DGA Diversity Award.
In the most recent collective bargaining negotiations, the Guild negotiated a provision requiring each of the major television studios to establish a television director development program designed to expand opportunities for women and minority directors in episodic television. Additionally, the Guild negotiated the establishment of an industry-wide Joint Diversity Action Committee, to meet at least every four months, to enhance communication and provide regular feedback on the studios’ diversity efforts as well as to address industry-wide diversity issues. The first meeting is scheduled for October of this year.
Over the past four years, DGA executives and members of the Diversity Task Force have held dozens of meetings with studios, production companies, and individual shows specifically to address diversity in hiring. At these meetings, the DGA presents employment statistics that bring non-diverse hiring practices into stark relief, and provides a contact list of experienced women and minority directors to make it easier for producers making hiring decisions. This list can also be obtained by any production company by contacting the DGA. While not every meeting has resulted in improved diversity, the DGA is pleased to see that some shows have made a noticeable improvement following these meetings.
Additionally, the Guild’s African American, Asian American, Latino, Women’s, Eastern Diversity, and EDC Focus on Women Committees continue to hold networking events with producers, networks and studio representatives to introduce talented directors to key producers and television executives; program educational seminars; and organize tribute events to highlight the excellent work being done by diverse directors.
The Best and the Worst of 2013-2014
The shows highlighted below are from major production companies ABC, CBS, Fox, HBO, NBC, Sony, Warner Bros. and other production companies whose shows appear on broadcast, basic cable, and premium cable networks as well as high-budget original content shows made under a DGA agreement for the Internet: Alpha House; Betas; Hemlock Grove; House of Cards; and Orange is the New Black. Pilots are not included in the statistics.
Additional data on the more than 220 series included in this year’s report can be found at the bottom of this release.
DGA's "WORST OF" List
Below are the shows with the worst records of hiring women and minority directors for the 2013-2014 television season. Shows that are BOLDED also appeared on the DGA’s “Worst Of” lists last year:
SHOWS THAT HIRED WOMEN OR MINORITY DIRECTORS FOR FEWER THAN 15% OF EPISODES (SOME OF THESE SHOWS DIDN’T HIRE A SINGLE WOMAN OR MINORITY ALL SEASON):
Title (Network/Studio/Production Company) – % of Episodes by Women or Minority Directors:
-
Back In The Game (ABC/Twentieth Century Fox Film Corporation/Twentieth Century Fox Television) – 0%
-
Betas (Amazon.com/Picrow/Picrow) – 0%
-
Boardwalk Empire (HBO/Home Box Office/Home Box Office) – 0%
-
Crossbones (NBC/Universal Television/Northern Entertainment Productions) – 0%
-
Defiance (Syfy/Universal Network Television/Open 4 Business Productions) – 0%
-
Eastbound & Down (HBO/Home Box Office/Home Box Office) – 0%
-
The Exes (TV Land/Hudson Street Productions/King Street Productions) – 0%
-
Fargo (FX/MGM Television Entertainment/Redhawk Productions) – 0%
-
Granite Flats (PBS/Remnant Pictures/Remnant Pictures) – 0%
-
Hannibal (NBC/Chiswick Productions/Chiswick 2 Productions) – 0%
-
Hello Ladies (HBO/Home Box Office/Home Box Office) – 0%
-
Hot In Cleveland (TV Land/Hudson Street Productions/King Street Productions) – 0%
-
It’s Always Sunny In Philadelphia (FXX/Sunny Television Productions/Sunny Television Productions) – 0%
-
Last Man Standing (ABC/Twentieth Century Fox Film Corporation/Twentieth Century Fox Television) – 0%
-
Maron (IFC/Fox Television Studios/TVM Productions) – 0%
-
Mixology (ABC/ABC/ABC Studios) – 0%
-
Mob City (TNT/Turner Films/Turner North Center Productions) – 0%
-
Nikita (CW/Warner Bros. Television/NS Pictures) – 0%
-
Perception (TNT/ABC/FTP Productions) – 0%
-
The Red Road (Sundance Channel/Stu Segall Productions/Stu Segall Productions) – 0%
-
Resurrection (ABC/ABC/FTP Productions) – 0%
-
Witches of East End (Lifetime/Pacific 2.1 Entertainment Group/Pacific 2.1 Entertainment Group) – 0%)
-
Workaholics (Comedy Central/Avalon Television/50/50 Productions) – 0%
-
The Big Bang Theory (CBS/Warner Bros Television/Warner Bros. Television) – 4%
-
Girl Meets World (Disney Channel/It’s a Laugh Productions/It’s a Laugh Productions) – 5%
-
I Didn't Do It (Disney Channel/It’s a Laugh Productions/It’s a Laugh Productions) – 5%
-
Kickin' It (Disney XD/It’s a Laugh Productions/It’s a Laugh Productions) – 5%
-
Mom (CBS/Warner Bros. Television/Warner Bros. Television) – 5%
-
Sam & Cat (Nickelodeon/MTV Networks/Uptown Productions) – 5%
-
Beauty & the Beast (CW/Take 5 Productions/BATB II Productions) – 6%
-
Supernatural (CW/Warner Bros. Television/NS Pictures) – 6%
-
The Americans (FX/Fox Television Studios/TVM Productions) – 8%
-
Betrayal (ABC/ABC/ABC Studios) – 8%
-
Big Time Rush (Nickelodeon/MTV Networks/Uptown Productions) – 8%
-
Californication (Showtime/Showtime Pictures Development Company/Showtime Pictures Development Company) – 8%
-
Enlisted (FOX/Twentieth Century Fox Film Corporation/Twentieth Century Fox Television) – 8%
-
Justified (FX/CPT Holdings/Woodridge Productions) – 8%
-
NCIS (CBS/CBS Studios/CBS Studios) – 8%
-
Once Upon a Time in Wonderland (ABC/ABC/Digital 49 Productions) – 8%
-
CSI: Crime Scene Investigation (CBS/CBS Broadcasting/CBS Broadcasting) – 9%
-
The Mindy Project (FOX/Universal Network Television/Open 4 Business Productions) – 9%
-
The Neighbors (ABC/ABC/FTP Productions) – 9%
-
Ray Donovan (Showtime/Showtime Pictures Development Company/Showtime Pictures Development Company) – 9%
-
The 100 (CW/Warner Bros. Television/Bonanza Productions) – 10%
-
Bates Motel (A&E/Universal Television/Universal Television) – 10%
-
The Blacklist (NBC/CPT Holdings/Woodridge Productions) – 10%
-
The Crazy Ones (CBS/Twentieth Century Fox Film Corporation/Twentieth Century Fox Television) – 10%
-
The Michael J. Fox Show (NBC/CPT Holdings/Topanga Productions) – 10%
-
Sullivan & Son (TBS/Warner Bros. Television/Horizon Scripted Television) – 10%
-
Dads (FOX/Twentieth Century Fox Film Corporation/Twentieth Century Fox Television) – 11%
-
King & Maxwell (TNT/CBS Broadcasting/CBS Overseas Productions Two) – 11%
-
The Last Ship (TNT/Turner Films/Turner North Center Productions) – 11%
-
Those Who Kill (A&E/Pacific 2.1 Entertainment Group/Pacific 2.1 Entertainment Group) – 11%
-
Turn (AMC/Stu Segall Productions/Stalwart Films) – 11%
-
Dog with a Blog (Disney Channel/It’s a Laugh Productions/It’s a Laugh Productions) – 13%
-
Castle (ABC/ABC/ABC Studios) – 13%
-
The Goldbergs (ABC/CPT Holdings/Remote Broadcasting) – 13%
-
Masters of Sex (Showtime/CPT Holdings/Remote Broadcasting) – 13%
-
Super Fun Night (ABC/Warner Bros. Television/Bonanza Productions) – 13%
-
Looking (HBO/Home Box Office/Home Box Office) – 14%
-
Once Upon A Time (ABC/ABC/Digital 49 Productions) – 14%
-
Surviving Jack (FOX/Warner Bros. Television/Warner Bros. Television) – 14%
DGA's "BEST OF" List
The following shows are highlighted for hiring women and minorities to direct at least 40% of episodes in the 2013-2014 production cycle. Shows that are BOLDED also appeared on the DGA’s “Best Of” list last year:
SHOWS THAT HIRED WOMEN OR MINORITY DIRECTORS FOR AT LEAST 40% OF EPISODES:
-
The Game (BET/BET Productions/Breakdown Productions) – 100%
-
Hit the Floor (VH1/MTV Networks/Bling Productions) – 100%
-
Let's Stay Together (BET/BET Productions/Breakdown Productions) – 100%
-
The Real Husbands of Hollywood (BET/JSR Productions/JSR Productions) – 100%
-
Single Ladies (VH1/MTV Networks/Bling Productions) – 100%
-
Power (Starz!/Starz Independent/Starz Power Productions) – 75%
-
Warehouse 13 (Syfy/Universal Network Television/Universal Network Television) – 75%
-
From Dusk Till Dawn: The Series (El Rey Network/Tres Pistoleros/Dusk Productions) – 70%
-
Drop Dead Diva (Lifetime/CPT Holdings/Woodridge Productions) – 69%
-
Mike & Molly (CBS/Warner Bros. Television/Bonanza Productions) – 68%
-
The Divide (WE/Stu Segall Productions/Stalwart Films) – 67%
-
The Following (FOX/Warner Bros. Television/Bonanza Productions) – 67%
-
Homeland (Showtime/Pacific 2.1 Entertainment Group/Pacific 2.1 Entertainment Group) – 67%
-
The Leftovers (HBO/Warner Bros. Television/Warner Bros. Television) – 67%
-
The Fosters (ABC Family/Prodco/Prodco) – 65%
-
Suburgatory (ABC/Warner Bros. Television/Bonanza Productions) – 62%
-
The Soul Man (TV Land/Hudson Street Productions/King Street Productions) – 60%
-
Halt and Catch Fire (AMC/Stu Segall Productions/Stalwart Films) – 56%
-
Devious Maids (Lifetime/ABC/ABC Studios) – 54%
-
The Middle (ABC/Warner Bros. Television/Warner Bros. Television) – 54%
-
Awkward (MTV/MTV Networks/On-Site Productions) – 50%
-
The Bridge (FX/Concord Productions/Concord Productions) – 50%
-
Chasing Life (ABC Family/Sprodco/Sprodco) – 50%
-
Full Circle (DirecTV/Momentum TV/Full Circle Show) – 50%
-
The Good Wife (CBS/CBS Studios/Eye Productions) – 50%
-
Lab Rats (Disney XD/It’s a Laugh Productions/It’s a Laugh Productions) – 50%
-
Modern Family (ABC/Twentieth Century Fox Film Corporation/Twentieth Century Fox Television) – 50%
-
Nashville (ABC/Lions Gate Television/Music City Productions) – 50%
-
See Dad Run (Nickelodeon/MTV Networks/Uptown Productions) – 50%
-
Suits (USA Network/Universal Network Television/Open 4 Business Productions) – 50%
-
Switched at Birth (ABC Family/Prodco/Prodco) – 50%
-
American Horror Story (FX/Brightstar Fox Investments/Brightstar Fox Productions) – 46%
-
The Carrie Diaries (CW/Warner Bros. Television/Warner Bros. Television) – 46%
-
Hart of Dixie (CW/Warner Bros. Television/Bonanza Productions) – 45%
-
Broad City (Comedy Central/Jax Media/Jax Media) – 44%
-
Instant Mom (Nick Jr./MTV Networks/Uptown Productions) – 44%
-
Low Winter Sun (AMC/Endemol Studios/Michigan Sun Productions) – 44%
-
Killer Women (ABC/New Mexico Production Services Group/New Mexico Production Services Group) – 43%
-
Elementary (CBS/CBS Studios/Eye Productions) – 42%
-
Girls (HBO/Home Box Office/Home Box Office) – 42%
-
Ironside (NBC/Universal Television/Universal Television) – 42%
-
Orange is the New Black (Netflix/Lady Prison Productions/Lady Prison Productions) – 42%
-
Pretty Little Liars (ABC Family/Warner Bros. Television/Horizon Scripted Television) – 42%
-
Star-Crossed (CW/Eye Productions/Danni Productions) – 42%
-
Two Broke Girls (CBS/Warner Bros. Television/Bonanza Productions) – 42%
-
Welcome to the Family (NBC/CPT Holdings/Remote Broadcasting) – 42%
-
Grimm (NBC/Universal Network Television/Open 4 Business Productions) – 41%
-
Getting On (HBO/Home Box Office/Home Box Office) – 40%
-
Men At Work (TBS/CPT Holdings/Remote Broadcasting) – 40%
The DGA included series that completed their runs or were cancelled mid-season on its “Best Of” and “Worst Of” lists. Shows that are primarily directed by only one director for the entire season were included in the overall data, but are not singled out in the lists above. Similarly, foreign series shot abroad with a significant number of episodes that were not covered by a DGA agreement were also not included in the lists above, but the episodes that were made under a DGA agreement were included in the overall statistics. The shows that meet either criteria include: Baby Daddy; Being Mary Jane; Dracula; Ground Floor; How I Met Your Mother; Kirstie; The Knick; The League; Legit; Liv and Maddie; Louie; Love That Girl; The Millers; Outlander; The Rickey Smiley Show; Saint George; Sean Saves the World; True Detective; Two And A Half Men; Tyler Perry’s For Better or Worse; Tyler Perry’s The Haves and The Have Nots; Tyler Perry’s Love Thy Neighbor; When Calls The Heart; and Wilfred.
Additional Data
Click the links below to download PDF spreadsheets of the full DGA Episodic Diversity Report organized by specific criteria:
Report by % of Episodes Directed by Women & Minorities (PDF)
Report by % of Episodes Directed by Women (PDF)
Report by % of Episodes Directed by Minorities (PDF)
Report by Signatory Company (PDF)
For any questions regarding the data included in these spreadsheets, please contact Lily Bedrossian at 310-289-5333 or email lbedrossian@dga.org.
Click here for a PDF copy of the complete 2014 DGA Episodic Television Diversity Hiring Report.
The DGA compiled the statistics for this report from information provided by the production companies to the DGA pursuant to the requirements of the collective bargaining agreement for episodes produced during the 2013-2014 season, and then validated the data directly with the shows themselves, and then again with a labor relations representative at the production company if available. A few shows failed to verify their statistics, in which case the DGA made its best effort to validate the data with someone at the production company level. All figures were rounded to the nearest percentage.